Multisim8
•
0 likes•1 view

The document introduces the basic interface of Multisim 8 simulation software. It includes menus, toolbars, circuit window, component library, and instruments. The menus provide most functions of the software. The toolbars offer quick access to common tools like open, save, zoom etc. The component library contains both ideal and real world components categorized in libraries. The instruments toolbar contains various tools to test circuit operation.

More Related Content
Similar to Multisim8
Similar to Multisim8 (20)
More from byron zhao
More from byron zhao (20)
Multisim8
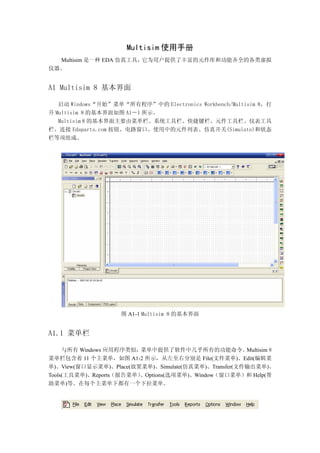
- 1. Multisim 使用手册 Multisim 是一种 EDA 仿真工具,它为用户提供了丰富的元件库和功能齐全的各类虚拟 仪器。 A1 Multisim 8 基本界面 启动 Windows“开始”菜单“所有程序”中的 Electronics Workbench/Multisim 8,打 开 Multisim 8 的基本界面如图 A1-1 所示。 Multisim 8 的基本界面主要由菜单栏、系统工具栏、快捷键栏、元件工具栏、仪表工具 栏、连接 Edaparts.com 按钮、电路窗口、使用中的元件列表、仿真开关(Simulate)和状态 栏等项组成。 图 A1-1 Multisim 8 的基本界面 A1.1 菜单栏 与所有 Windows 应用程序类似, 菜单中提供了软件中几乎所有的功能命令。 Multisim 8 菜单栏包含着 11 个主菜单,如图 A1-2 所示,从左至右分别是 File(文件菜单)、Edit(编辑菜 单)、View(窗口显示菜单)、Place(放置菜单)、Simulate(仿真菜单)、Transfer(文件输出菜单)、 、Options(选项菜单)、Window(窗口菜单)和 Help(帮 Tools(工具菜单)、Reports(报告菜单) 助菜单)等。在每个主菜单下都有一个下拉菜单。
- 2. A1-2 菜单栏 1.File(文件)菜单 主要用于管理所创建的电路文件,如打开、保存和打印等,如图 A1-3 所示。 图 A1-3 File 菜单 New:提供一个空白窗口以建立一个新文件。 Open:打开一个已存在的*.ms8、*.ms7、*.msm、*.ewb 或*.utsch 等格式的文件。 Close:关闭当前工作区内的文件。 Save:将工作区内的文件以*.ms8 的格式存盘。 Save As:将工作区内的文件换名存盘,仍为*.ms8 格式。 Print..:打印当前工作区内的电路原理图。 Print Preview:打印预览。 Print Options:打印选项,其中包括 Printer Setup(打印机设置) 、Print Circuit Setup(打印电路设置)、Print Instruments(打印当前工作区内的仪表波形图) 。 Recent Circuits:最近几次打开过的文件,可选其中一个打开。 New Project、Open Project、Save Project 和 Recent Projects 命令是指对某些专题 文件进行的处理,仅在专业版中出现,教育版中无功能。 2.Edit(编辑)菜单 主要用于在电路绘制过程中,对电路和元件进行各种技术性处理,如图 A1-4 所示。
- 3. 图 A1-4 Edit 菜单 其中 Cut(剪切) 、Copy(拷贝)等大多数命令与一般 Windows 应用软件基本相同,不 再介绍。 Find:搜索。 Graphic Annotation:图形注解。 Order:排序。 Assign to Layer:指定到层。 Layer Setting:层设置。 Title Block Position:标题栏位置设置。 Orientation:旋转。 Edit Symbol/Title Block..:编辑符号/标题栏。 Font..:字体设置。 Properties..:属性设置。 3.View(窗口显示)菜单 用于确定仿真界面上显示的内容以及电路图的缩放和元件的查找,如图 A1-5 所示。
- 4. 图 A1-5 View 菜单 Full Screen:全屏显示。 Zoom In:放大。 Zoom Out:缩小。 Zoom Area:局部放大。 Zoom Fit to Page:窗口显示完整电路。 Show Grid:显示栅格。 Show Border:显示边界。 Show page Bound:显示纸张边界。 Ruler bars:显示标尺栏。 Status Bar:显示状态栏。 Design Toolbox:显示设计文件夹。 Spreadsheet View:显示电子数据表。 Circuit Description Box:显示电路描述文件夹。 Toolbars:选择工具栏。 Grapher:显示图表。 4.Place(放置)菜单 提供在电路窗口内放置元件、连接点、总线和文字等命令,如图 A1-6 所示。
- 5. 图 A1-6 Place 菜单 Component:放置一个元件。 Junction:放置一个节点。 Wire:放置一根连接线。 Bus:放置一根总线。 Connectors:放置连接。 Hierarchical Block From File..:子块调用。 New Hierarchical Block..生成新的子块。 Replace by Hierarchical Block..:由一个子块替换。 New Subcircuit:放置一个子电路。 Replace by Subcircuit..:用一个子电路替换。 Multi-Page..:多页设置。 Comment:放置注释。 Text:放置文字。 Graphics:放置图片。 Title Block..:放置标题栏。 5.Simulate (仿真)菜单 提供电路仿真设置与操作命令,如图 A1-7 所示。
- 6. 图 A1-7 Simulate 菜单 Rum:运行仿真开关。 Pause:暂停仿真。 Instrument:选择仿真仪表。 Interactive Simulation Settings..:交互仿真设置。 Digital Simulation Settings:数字仿真设置。 Analyses:选择仿真分析法。 Postprocessor..:打开后处理器对话框。 Simulation Error Log/Audit Trail:仿真错误记录/检查路径。 Xspice Command Line Interface..:Xspice 命令行输入界面。 Load Simulation Settings..:装载仿真文件。 Save Simulation Settings..:保存仿真文件。 Auto Fault Option:自动设置电路故障。 Probe Properties:探针属性设置。 Reverse Probe Direction:翻转探针方向。 Clear Instrument Data:清除仪表数据。 Global Component Tolerance:全局元件容差设置。 6.Transfer(文件输出)菜单 提供将仿真结果传递给其他软件处理的命令,如图 A1-8 所示。
- 7. 图 A1-8 Transfer 菜单 Transfer to Ultiboard:传送给 Ultiboard。 Transfer to other PCB Layout:传送给其他 PCB 版图软件。 Forward Annotate to Ultiboard:反馈注释到 Ultiboard。 Backannotate from Ultiboard:从 Ultiboard 返回的注释。 Highlight Selection in Ultiboard:高亮 Ultiboard 上的选择项。 Export Netlist:输出网表。 7.Tools(工具)菜单 主要用于编辑或管理元器件和元件库,如图 A1-9 所示。 图 A1-9 Tools 菜单
- 8. Component Wizard:打开创建元件对话框。 Database:打开数据库对话框。 555 Timer Wizard..:打开创建 555 定时器对话框。 Filter Wizard..:打开创建滤波器对话框。 CE BJT Amplifier Wizard..:打开创建共射极晶体管放大器对话框。 Rename/Renumber Components..:打开元件命名/标号对话框。 Replace Component..打开替换元件对话框。 Update Circuit Components:打开升级电路元件对话框。 Electrical Rules Check..:打开电规则检查对话框。 Clear ERC Markers:打开清除 ERC 标志对话框。 Title Block Editor:打开标题栏编辑对话框。 Description Box Editor:打开电路描述对话框。 Edit Labels:打开符号编辑对话框。 Capture Screen Area:捕捉屏幕区域。 Internet Design Sharing:打开网络设计共享对话框。 Education Web Page:打开教学网页。 EDAparts.com:连接 EDAparts.com 网站。 Show Breadboard:打开面包板设计页。 8.Report(报告)菜单 列出了 Multisim 可以输出的各种表格、清单,如图 A1-10 所示。 图 A1-10 Report 菜单 9.Options(选项)菜单 用于定制电路的界面和电路某些功能的设定,如图 A1-11 所示。 图 A1-11 Options 菜单 Global Preferences..:全局选项设置。 Sheet Properties..:页属性设置。
- 9. Global Restriction:全局限制设置。 Circuit Restriction:电路限制设置。 Simplified Version:简化版本。 Customize User Interface..:定制用户界面。 A1.2 系统工具栏 系统工具栏包含了常用的基本功能按钮,如新建、打开、保存、打印、放大和缩小等, 与 Windows 的基本功能相同,如图 A1-12 所示。 图 A1-12 系统工具栏 A1.3 快捷键栏 快捷键栏如图 A1-13 所示。 图 A1-13 设计工具栏 借助快捷键栏可方便地进行一些操作,虽然前述菜单中也可以执行这些操作,但使用 快捷键会更方便。这 11 个快捷键按钮从左至右分别为: 设计文件夹按钮(Show or hide design toolbox):显示或隐藏设计文件夹。 电子数据表按钮(Show or hide spreadsheet bar) :显示或隐藏电子数据表。 数据库按钮(Database manager):打开数据库管理器。 元件按钮(create component):打开创建元件对话框。 仿真按钮(Run/stop simulation F5):用以确定开始、暂停或结束电路仿真。也可用 F5 键)。 分析按钮(Grapher/analyses list): 用以选择要进行的分析。 后处理按钮(Postprocessor): 用以进行对仿真结果的进一步操作。 电规则检查按钮(Electrical Rules Check):打开电规则检查对话框。 面包板按钮(Show Breadboard) :打开面包板设计页。 传输按钮(Backannotate from Ultiboard)(Forward Annotate) 、 :用以与 Ultiboard 进行通信。 A1.4 元件工具栏 Multisim 8 将元件模型按虚拟元件库和实际元件分类放置。带兰色衬底的是虚拟元件 库,如图 A1-14 所示,其中存放的是具有一个默认值的非标准化元件,选取这样的元件后, 对其双击可以进行参数的任意设置;图 A1-15 所示的是实际元件库,其中存放的是符合实 际标准的元件,通常在市场上可以买到。为了使设计的电路符合实际情况,应该尽量从实际 元件库中选取元件。
- 10. 虚拟元件库分 10 个元件分类库,每个元件库放置同一类型的元件,从左到右分别是: 电源库(Power Sources)、 信号源元件库(Signal Sources Components)、 基本元件库(Basic)、 二极管库(Diodes Components)、晶体管库(Transistors Components)、模拟元件库(Analog Components) 、 混 合 元 件 库 (Miscellaneous Components) 、 测 量 元 件 库 (Measurement Components)、额定元件库(Rated Virtual Components)和 3D 元件库(3D Components )。 图 A1-14 理想元件库工具栏 实际元件库中放置的是各种实际元件,从左到右分别是:电源库(Sources) 、基本元件 库(Basic) 、二极管库(Diode)、三极管库(Transistor)、模拟元件库(Analog)、TTL 元件 库(TTL)、CMOS 元件库(CMOS)、各种数字元件库(Misc Digital)、数模混合元件库(Mixed)、 指 示 元 件 库 (Indicator) 、 混 合 元 件 库 (Miscellaneous Components) 、 机 电 类 元 件 库 (Electromechanical)、射频元件库(RF)。 图 A1-15 实际元件库工具栏 A1.5 仪表工具栏 该工具栏含有 19 种用来对电路工作状态进行测试的仪器仪表,习惯上将其工具栏放置 于工作台的右边,如图 A1-16 所示。
- 11. 图 A1-16 仪表工具栏 从上至下,分别是数字万用表(Multimeter)、函数信号发生器(Function Generator)、 瓦特表(Wattmeter)、示波器(Oscilloscope)、4 通道示波器(4 Channel Oscilloscope)、 波 特 图 仪 (Bode Plotter) 、 频 率 计 数 器 (Frequency Counter) 、 字 信 号 发 生 器 (Word Generator)、逻辑分析仪(Logic Analyzer)、逻辑转换仪(Logic Converter)、IV 分析仪 (IV-Analysis)、失真分析仪(Distortion Analyzer)、频谱分析仪(Spectrum Analyzer)、 网络分析仪(Network Analyzer)、Agilent 函数发生器(Agilent Function Generator)、 Agilent 数字万用表(Agilent Multimeter)、Agilent 示波器(Agilent Oscilloscope) 、 Tektronix 示波器(Tektronix Oscilloscope)和节点测量表(Measurement probe)等。 A1.6 其它 1..com 按钮 元 件 工 具 栏 中 还 有 一 个 .com 按 钮, 点 击 该 按 钮 , 用 户 可 以 自 动 通 过 因 特 网 进 入 EDAparts.com 网站。这是一个由 EWB 和 ParMiner 合作开发,提供给 Multisim 用户的因特 网入口, 用户可以访问超过一千多万个器件的 CAPSXper 数据库, 并可从 ParMiner 直接把有 关元件的信息和资料下载到自己的数据库中。 另外, 还可从侅网站免费下载到专为 Multisim 设计的升级 Multisim Master 元件库的文件。 2.电路窗口 电路窗口也称为 Workspace,相当于一个现实工作中的操作平台,在界面的中央,电路 图的编辑绘制、仿真分析及波形数据显示等都将在此窗口中进行。 3.使用中元件列表(In Use List) 使用中元件列表列出了当前电路所使用的全部元件,以供检查或重复调用。 4.仿真开关 仿真开关用以控制仿真进程,一般在界面的右上角。 5.状态栏 状态栏显示有关当前操作以及鼠标所指条目的有用信息,在界面的最下方。 A2 常用虚拟仪器使用 MultiSim 8 的仪器库(Instruments)较其早期版本有较大增加和完善,一共有 19 种虚 拟仪器, 这些仪器可用于各种模拟和数字电路的测量。 使用时只需单击仪器库中该仪器图标, 拖动放置在相应位置即可,对图标双击可以得到该仪器的控制面板。 尽管虚拟仪器的基本操作与现实仪器非常相似, 仍存在一定的区别。 需要特别指出的是 MultiSim 8 还提供了世界著名的两家仪器公司 Agilent 和 Tektronix 的多款仪器及其“真 实形象”的用户界面供用户使用。为了更好地使用这些虚拟仪器,这里将介绍几种最常用的 虚拟仪器的使用方法。 A2.1 函数信号发生器(Function Generator) 函数信号发生器是用来产生正弦波、方波和三角波信号的仪器,对于三角波和方波可 以设置其占空比(Duty cycle)大小,对偏置电压的设置(Offset)可将正弦波、方波和三 角波叠加到设置的偏置电压上输出。其图标和面板如图 A2-1 所示。
- 12. 图 A2-1 函数信号发生器图标和面板 1.连接规则 连接函数信号发生器的图标有“+”“Commom”和“-”三个端子,它们与外电路相连 、 输出电压信号,其连接规则是: (1) 连接“+”和“Commom”端子,输出信号为正极性信号,幅值等于信号发生器的 有效值。 (2) 连接“Commom”和“-”端子,输出信号为负极性信号,幅值等于信号发生器的 有效值。 (3) 连接“+”和“-”端子,输出信号的幅值等于信号发生器的有效值的两倍。 (4) 同时连接“+”“Common”和“-”端子,且把“Common”端子与公共地(Ground) 、 连接,则输出两个幅值相等、极性相反的信号。 2.面板操作 对面板各区域的不同设置,可改变输出电压信号的波形类型、大小、占空比或偏置电压 等: (1)Waveforms 区 选择输出信号的波形类型,有正弦波、方波和三角波 3 种周期性信号供选择。 (2)Signal Options 区 对 Waveforms 区中选取的信号进行相关参数设置。 ·Frequency:设置所要产生信号的频率,范围在 1Hz~999MHz。 ·Duty Cycle:设置所要产生信号的占空比,设定范围为 1%~99%。 ·Amplitude:设置所要产生信号的最大值(电压) ,其可选范围从 1μV 级到 999kV。 ·Offset:设置偏置电压,即把正弦波、三角波、方波叠加在设置电压上输出,其可选 范围从 1μV 级到 999kV。 (3)Set Rise/Fall Time 按钮 设置所要产生的信号的上升时间与下降时间, 该按钮只在产生方波时有效。 点击该按钮 后,出现如图 A2-2 所示的对话框。
- 13. 图 A2-2 Set Rise/Fall Time 对话框 在栏中以指数格式设定上升时间(下降时间) ,再点击 Accept 按钮即可。如点击 Default,则为默认值 1.000000e-12。 3.其他函数信号发生器 MultiSim 8 的 仪 器 库 中 还 包 括 Agilent 函 数 发 生 器 (Agilent Function Generator) ,该仪器的图标和面板如图 A2-3 所示。 图 A2-3 Agilent 函数发生器的图标和面板 从图 A2-3 可以看出,Agilent 函数发生器的面板与实际使用的仪器完全相同,其操 作方法与实际 Agilent 函数发生器相同,这里不再赘述。 A2.2 示波器(Oscilloscope) 示波器是电子实验中使用最频繁的仪器之一,可用来观察信号波形, 并可用来测量信号 幅度、频率及周期等参数。该仪器的图标和面板如图 A2-4 所示。 图 A2-4 示波器图标和面板
- 14. 1.连接规则 图 A2-4 所示的是一个双踪示波器,有 A、B 两个通道,G 是接地端,T 是外触发端, 该虚拟示波器与实际示波器的连接方式稍有不同: (1)A、B 两通道分别只需一根线与被测点相连,测量的是该点与“地”之间的波形。 (2)接地端 G 一般要接地,但当电路中已有接地符号时,也可不接。 2.面板操作 双踪示波器的面板操作如下: (1)Timebase 区 用来设置 X 轴方向时间基线扫描时间。 ·Scale:选择 X 轴方向每一个刻度代表的时间。点击该栏后将出现刻度翻转列表, 根据所测信号频率的高低,上下翻转选择适当的值。 ·X position:表示 X 轴方向时间基线的起始位置,修改其设置可使时间基线左右 移动。 ·Y/T:表示 Y 轴方向显示 A、B 两通道的输入信号,X 轴方向显示时间基线,并安设 置时间进行扫描。当显示随时间变化的信号波形(例如三角波、方波及正弦波等)时,常采 用此种方式。 ·B/A:表示将 A 通道信号作为 X 轴扫描信号,将 B 通道信号施加在 Y 轴上。 ·A/B:与 B/A 相反。 以上这两种方式可用于观察李萨育图形。 ·ADD:表示 X 轴按设置时间进行扫描,而 Y 轴方向显示 A、B 通道的输入信号之和。 (2)Channel A 区 用来设置 Y 轴方向 A 通道输入信号的标度。 ·Scale:表示 Y 轴方向对 A 通道输入信号而言每格所表示的电压数值。点击该栏后 将出现刻度翻转列表,根据所测信号电压的大小,上下翻转选择适当的值。 ·Y position:表示时间基线在显示屏幕中的上下位置。当其值大于零时,时间基线 在屏幕上侧,反之在下侧。 ·AC:表示屏幕仅显示输入信号中的交变分量(相当于实际电路中加入了隔直电容) 。 ·DC:表示屏幕将信号的交直流分量全部显示。 ·0:表示将输入信号对地短接。 (3)Channel B 区 用来设置 Y 轴方向 B 通道输入信号的标度,其设置与 Channel A 区相同。 (4)Trigger 区 用来设置示波器的触发方式。 ·Edge:表示将输入信号的上升沿或下降沿作为触发信号。 ·Level:用于选择触发电平的大小。 ·Sing:选择单脉冲触发。 ·Nor:选择一般脉冲触发。 ·Auto:表示触发信号不依赖外部信号。一般情况下使用 Auto 方式。 ·A 或 B:表示用 A 通道或 B 通道的输入信号作为同步 X 轴时基扫描的触发信号。 ·Ext:用示波器图标上触发端子 T 连接的信号作为触发信号来同步 X 轴时基扫描。 3.测量波形参数 在屏幕上有两条左右可以移动的读数指针,指针上方有三角形标志,如图 A2-4 所示。 通过鼠标左键可拖动读数指针左右移动。 在显示屏幕下方的测量数据的显示区中显示了两个波形的测量数据,分别是:
- 15. Time:从上到下的三个数据分别是 1 号读数指针离开屏幕最左端(时基线零点)所对应 的时间、2 号读数指针离开屏幕最左端(时基线零点)所对应的时间、两个时间之差,时间 单位取决于 Timebase 所设置的时间单位; Channel A: 从上到下的三个数据分别是 1 号读数指针所指通道 A 的信号幅度值、通道 B 的信号幅度值、两个幅度之差,其值为电路中测量点的实际值,与 X、Y 轴的 Scale 设置 值无关。 Channel B: 从上到下分别是 2 号读数指针所指通道 A 的信号幅度值、通道 B 的信号幅 度值、两个幅度之差。 为了测量方便准确,点击 Pause(或 F6 键)使波形“冻结” ,然后再测量更好。 4.设置信号波形显示颜色 只要在电路中设置 A、B 通道连接导线的颜色,波形的显示颜色便与导线的颜色相同。 方法是双击连接导线,在弹出的对话框中设置导线颜色即可。 5.改变屏幕背景颜色 点击展开面板右下方的 Reverse 按钮, 即可改变屏幕背景的颜色, 要将屏幕背景恢复为 原色,再次点击 Reverse 按钮即可。 6.存储数据 对于读数指针测量的数据,点击展开面板右下方的 Save 按钮即可将其存储,数据存储 格式为 ASCII 码格式。 7.移动波形 在动态显示时,点击 (暂停)按钮或按 F6 键,通过改变 X position 设置,可实 现左右移动波形。 8.其他示波器 (1)Agilent 示波器 MultiSim 8 的仪器库中还包括 Agilent 示波器(Agilent Oscilloscope) ,该仪器 的图标和面板如图 A2-5 所示。 图 A2-5 Agilent 示波器的图标和面板 该虚拟仪器的操作方法与实际 Agilent 示波器相同。 (2)四通道示波器(4 ChannelOscilloscope) MultiSim 8 的仪器库中提供了一台四通道示波器,其图标和面板如图 A2-6 所示。 该示波器的通道数由常见的 2 变为 4,使用方法与 2 通道的示波器相似。
- 16. 图 A2-6 四通道示波器的图标和面板 (3)Tektronix 示波器 MultiSim 8 的 仪 器 库 (Instruments) 中 还 包 括 Tektronix 示 波 器 (Tektronix Oscilloscope) ,该仪器的图标和面板如图 A2-7 所示。 图 A2-7 Tektronix 示波器的图标和面板
- 17. 该示波器的操作方法与实际 Agilent 示波器相同。 A2.3 波特图仪(Bode Plotter) 波特图仪(Bode Plotter) 是测量电路、系统或放大器频幅特性 A(f)和相频特性 ϕ (f)的虚拟仪器,类似与实验室的频率特性测试仪(或扫描仪),图 A2-8 是波特图仪的图 标和面板。 图 A2-8 波特图仪图标和面板 1.连接规则 波特图仪的图标包括着 4 个连接端,左边 IN 是输入端口,其+、-分别与电路输入端的 正负端子相连;右边 OUT 是输出端口,其+、-分别与电路输出端的正负端子相连。由于波 特图仪本身没有信号源, 所以在使用波特图仪时, 必须在电路的输入端口示意性地接入一个 交流信号源(或函数信号发生器) ,且无需对其参数进行设置。 2.面板操作 (1)Mode 区 ·Magnitude:选择它显示屏里展开幅频特性曲线。 ·Phase:选择它显示屏里展开相频特性曲线。 (2)Horizontal 区 确定波特图仪显示的 X 轴频率范围。 选择 Log,则标尺用 Logf 表示;若选用 LIN,即坐标标尺是线性的。当测量信号的频率 范围较宽时,用 Log 标尺为宜。 F 和 I 分别是频率的最终值(Final)和初始值(Initial)的缩写。 为了清楚地显示某一频率范围的频率特性,可将 X 轴频率范围设定得小一些。 (3)Vertical 区 设定波特图仪显示的 Y 轴的刻度类型。 测量幅频特性时,若点击 Log 按钮,Y 轴的刻度单位为 dB(分贝) ;点击 LIN 按钮后,Y 轴是线性刻度。测量相频特性时,Y 轴坐标表示相位,单位是度,刻度是线性的。 F 栏用以设置 Y 轴最终值,I 栏用以设置初始值。 需要指出的是:若被测电路是无源网络(谐振电路除外) ,由于 A(f)的最大值是 1, 所以 Y 轴坐标的最终值应设置为 0dB,初始值为负值。对于含有放大环节的网络,A(f)值 可大于 1,最终值设为正值(+dB)为宜。
- 18. (4)Contrlos 区 ·Reverse:改变屏幕背景颜色。 ·Save:以 BOD 格式保存测量结果。 ·Set:设置扫描的分辨率,点击该按钮后,屏幕出现如图 A2-9 所示的对话框。 图 A2-9 设置扫描分辨率对话框 在 Resolution Points 栏中选定扫描的分辨率,数值越大读数精度越高,但将增加运行 时间,默认值是 100。 3.测量波形参数 利用鼠标拖动(或点击读数指针移动按钮)读数指针,可测量某个频率点处的幅值或相 位,其读数在显示屏下方显示。 A3 基本分析方法 启动 Simulate 菜单中的 Analyses 命令,里面共有 18 种分析功能,从上至下分别为: 直流工作点分析(DC Operating Point Analysis) 、交流分析(AC Analysis)、瞬态分析 (Transient Analysis)、傅里叶分析(Fourier Analysis)、噪声分析(Noise Analysis)、噪 声图形分析(Noise figure Analysis)、失真分析(Distortion Analysis) 、直流扫描分析 (DC Sweep Analysis)、灵敏度分析(Sensitivity Analysis)、参数扫描(Parameter Sweep)、 温度扫描分析(Temperature Sweep Analysis)、极点-零点分析(Pore-Zero Analysis)、传 输函数分析(Transfer Function Analysis)、最坏情况分析(Worst Case Analysis)、蒙特 卡罗分析(Monte Carlo Analysis)、轨迹宽度分析(Trace Width Analysis)、批处理分析 (Batched Analysis) 、用户定义分析(User Defined Analysis)、及 RF 分析(RF) 。下面我 们主要介绍几种常用的分析方法。 A3.1 直流工作点分析 直流工作点分析(DC Operating Point Analysis)是在电路中电感短路、电容开路的 情况下,计算电路的静态工作点。直流分析的结果通常可用于电路的进一步分析,如在进行 暂态分析和交流小信号分析之前, 程序会自动先进行直流工作点分析, 以确定暂态的初始条 件和交流小信号情况下非线性化模型的参数。 下面以图 A3-1 所示的简单共射极放大电路为例, 介绍直流工作点分析的基本操作过程。 电路搭建完成后,在 Options Sheet Properties..中,Net Names 选择“Show All” ,这样 电路中所有节点号将被显示。 图中三极管取理想元件,将其β值修改成 80,把电位器的阻值调节到 70%-80%,此时用 示波器看到的波形没有失真,如图 A3-2 所示,电路处于放大状态。启动 Simulate 菜单中 Analyses 子菜单下的 DC Operating Point 命令,在如图 A3-3 所示的节点选择对话框中选
- 19. 择要仿真的节点, 节点为三极管基极,2 节点为集电极,6 节点为射极) (1 ,点击 Simulate 进行分析,得到如图 A3-4 所示的直流工作点仿真结果,即 VBE = VB − VE = 1.96367 − 1.18780 = 0.77587V VCE = VC − VE = 9.44043 − 1.18780 = 8.25263V I C = (VCC − VC ) RC = (12 − 9.44043) 2.4 = 1.07 mA 图 A3-1 简单晶体管放大电路
- 20. 图 A3-2 放大状态波形 图 A3-3 节点选择对话框
- 21. 图 A3-4 直流工作点仿真结果 A3.2 交流分析 交流分析(AC Analysis)可以进行电路的小信号频率响应的仿真。分析时程序自动先 对电路进行直流工作点分析, 以建立电路中非线性元件的交流小信号模型, 并把直流电源置 零,交流信号源、电容及电感等用其交流模型,如果电路中含有数字元件,将认为是一个接 地的大电阻。交流分析时以正弦波为输入信号,即不管在电路的输入端为何种输入信号,进 行分析时都将自动以正弦波替换, 且信号的频率也将以设定的范围替换。 交流分析的结果以 幅频特性和相频特性两个图形显示。 如果将波特图仪连至电路的输入端和被测节点, 也可获 得同样的交流频率特性。 下面我们仍以图 A3-1 所示的简单共射极放大电路为例,说明如何进行交流分析。 电路搭建完成后,启动 Simulate 菜单中 Analyses 子菜单下的 AC Analysis 命令,在如 图 A3-5 所示的对话框中进行交流分析的起止频率等项的设定。
- 22. 图 A3-5 AC Analysis 对话框 在 Output 页里,选定分析节点 8 的电压传输特性如图 A3-6 所示。 图 A3-6 输出节点选择对话框 点击 Simulate 进行分析,其幅频特性和相频特性仿真结果如图 A3-7 所示。
- 23. 图 A3-7 幅频特性和相频特性仿真结果 A3.3 瞬态分析 瞬态分析(Transient Analysis)是一种非线性时域(Time Domain)分析,可以在激 励信号(或没有任何激励信号)的情况下计算电路的时域响应。分析时,电路的初始状态可 由用户自行指定,也可由程序自动进行直流分析,用直流解作为电路初始状态。瞬态分析的 结果通常是待分析节点的电压波形,故可用示波器观察结果。 我们用图 A3-8 所示的一个简单的正弦交流电路为例,说明瞬态分析的过程。启动 Simulate 菜单中 Analyses 下的 Transient Analysis 命令,出现瞬态分析对话框如图 A3-9 所示。 图 A3-8 简单的正弦交流电路
- 24. 图 A3-9 Transient Analysis 对话框 在对话框的 Output 页,可进行输出变量(节点 1 和 3 的电压)选择,如图 A3-10 所示。 图 A3-10 输出变量选择对话框 点击 Simulate 进行分析,其仿真结果如图 A3-11 所示。
- 25. 图 A3-11 瞬态分析仿真结果 A3.4 傅里叶分析 傅里叶分析(Fourier Analysis)是分析周期性非正弦波信号的一种数学方法,它将周 期性的非正弦波信号转换成一系列正弦波及余弦波,即 f (t ) = A0 + A1 cos ωt + A2 cos 2ωt + ... + B1 sin ωt + B2 sin 2ωt + ... 式中 A0 为原始信号的直流(平均)分量, ωt 项为基波分量, nωt 项为 n 次谐波分量, Ai 、 Bi 为第 i 次谐波分量的系数,ω为基波角频率。 下面以图 A3-12 所示的一个方波激励的 RC 电路为例,说明傅里叶分析的基本操作过程。 图 A3-12 方波激励的 RC 电路 启动 Simulate 菜单中 Analyses 下的 Fourier Analysis 命令,出现傅里叶分析对话框 如图 A3-13 所示。
- 26. 图 A3-13 傅里叶分析对话框 在 Output 页进行输出节点设置,如图 A3-14 所示。 图 A3-14 输出节点设置对话框 点击 Simulate 进行分析,傅里叶分析仿真结果如图 A3-15 所示。
- 27. 图 A3-15 傅里叶分析仿真结果 A4 电路仿真过程 本节将以图 A4-1 的共射极放大电路为例,说明 Multisim 的仿真过程。 图 A4-1 共射极放大电路 A4.1 编辑原理图 1.建立电路文件 打开 Multisim 基本界面如图 A1-1 所示,此时系统自动命名空白电路文件为 Circuit 1。 在 Multisim 正常运行时,如果启动 File/New 菜单,同样也会出现这样的空白电路文件。 2.设计电路界面 通过 Options 菜单中的若干选项,可以设计出个性化的界面。 (1)启动 Options/Preference,打开 Preference 对话框中的 Parts 页,如图 A4-2 所示, 对 Symbol standard 区内的电气元器件符号标准进行设置,Multisim 提供了两套元器件符号 标准,ANSI 是美国标准,DIN 是欧洲标准,我们选择 ANSI 标准。
- 28. 图 A4-2 Parts 页 (2) 打开 Options/Sheet Properties/Workspace 页如图 A4-3 所示,对其中的相关项进行 设置:选择 Show 区内的 Show Grid(也可从 View/Show Grid 菜单选取) ,则电路图中将出 现栅格;选择 Show 区内的 Show Border(也可从 View/Show Border 菜单选取) ,则电路窗口 就像一张标准图纸。 (3)打开 Options/Sheet Properties/Circuit 页如图 A4-4 所示,可以对元件符号显示 (component )、节点显示(Net Name) 、电路界面颜色(Color)等等进行设置。
- 29. 图 A4-3 Workspace 页
- 30. 图 A4-5 Circuit 页 3.电路搭建 电路界面设计好后,就可以进行电路搭建了。 (1)元件选择 根据图 A4-1 的电路图,从图 A1-14 所示的元件工具栏中可以进行元件的选择。待放 大的信号源、直流电源、接地端可以从电源库(Sources)中选取如图 A4-6 所示。 图 A4-6 电源器件选择 图 A4-6 中,双击元器件可以进行电源参数、符号等进行设置如图 A4-7 所示。
- 31. 图 A4-7 电源参数设置对话框 电阻、电容器件在基本元件库(Basic)中选择,如图 A4-8 所示。 图 A4-8 基本元件库 选取的元件如果方向不符合要求,可以由“Ctrl+R”快捷键或由 Edit 菜单中的旋转选 项进行旋转。 三极管从晶体管库(Transistors Components)选择如图 A4-9 所示。 图 A4-9 晶体管库 这种带绿色衬底的是虚拟元件库,实际 NPN 元件库中有各种信号的 NPN 型三极管如图 A4-10 所示,其中列出了国外几家大公司的产品,如 Zetex、National 等,没有我国的晶 体管器件模型,如果我们实际要用 3DG6(β=80)的三极管,只能在虚拟元件库中取一个 BJT_NPN_VIRTUAL 来代替,而它β的默认值是 100,可以进行修改:双击 BJT_NPN_VIRTUAL, 打开其属性对话框如图 A4-11 所示。
- 32. 图 A4-10 NPN 型三极管实际元件库 图 A4-10 BJT_NPN_VIRTUAL 属性对话框 点击 Value 页上的 Edit Model 按钮,打开 Edit Model 对话框如图 A4-11 所示,其中 有很多参数, 即β, BF 将它从 100 改为 80, 点击 Change Part Nodel 按钮,回到 BJT_NPN_VIRTUAL 属性对话框,点击“确定”按钮,则完成三极管β的修改。
- 33. 图 A4-11 Edit Model 对话框 这样图 A4-1 电路中所需的所有元件都选取在图 A4-12 所示的界面中,In Use List 栏内列出了电路所用的所有元件。 图 A4-12 已选取的所有元件 2.电路连线 元件选择后,就可以进行电路连线了,步骤是:将鼠标指向所要连接的元件引脚,鼠 标指针变成圆圈状,按住鼠标左键并开始移动鼠标,拉出一条虚线,如果要从某点转弯,点 击左键固定该点,继续移动直到终点,点击即完成一条连线。 整个电路完成连线后如图 A4-13 所示。
- 34. 图 A4-13 完成连线后的电路 3.电路的进一步编辑 为了使电路更加整洁、更便于仿真,可以做一些进一步编辑。 (1)修改元件参考序号。双击元件符号,在其属性对话框中可以进行参考序号修改。 (3) 修改元件或连线的颜色。 指针指向元件或连线, 点击右键出现下拉菜单,选择 Color 项,在弹出的颜色对话框中选择所需的颜色即可。 (4)删除元件或连线。选中要删除的元件或连线,按 Delete 键即可删除,删除元件时 相应的连线一同消失,但删除连线时不会影响元件。 4.保存文件 编辑后的电路图用 File/Save As 保存,这与一般文件的保存方法相同,保存后的文件 以.ms8 为后缀。 A4.2 电路仿真 参照 1.2 节,对这个共射极放大电路可以进行如下仿真。 1.静态工作点测试 参照 A3.1 节,可以进行电路的静态工作点测试。 2.测量电压放大倍数 可以在图 A3-2 的输入输出电压波形上读出电压的幅值,电路的电压放大倍数由它们 的比值得到;或者由图 A3-7 的幅频特性上得到电压放大倍数的波特值,运算后得到放大 倍数。 3.观察静态工作点对输出波形的影响 加大输入信号(例如 VS=150mV),用示波器观察输出波形,改变 RW,使输出电压出现 失真,如图 A4-14 所示,再启动静态工作点分析,测量此时的 VCE 值,分析波形失真与 VCE 之间的关系,并说明是什么失真?
- 35. 图 A4-14 失真波形 4.最大不失真输出电压 VOPP 的测量(最大动态范围) 先将静态工作点调至放大器正常工作情况(输出波形不失真) ,逐步增大输入信号的幅 度,并同时调节 RW(改变静态工作点) ,用示波器观察输出波形,当输出波形同时出现饱和 和截止失真时,说明静态工作点已调在交流负载线的中点。然后反复调整输入信号,使波形 输出幅度最大,且无明显失真,此时,用交流毫伏表测出 VO (有效值) ,则动态范围 VoPP = 2 2Vo ,或在示波器上直接读出 VoPP。 5.放大器频率特性的测量 A3.2 节中介绍了用交流分析的手段测量频率特性的方法,还可以使用波特图仪测量来 进行频率特性的测量。将波特图仪与电路连接如图 A4-15 所示,启动仿真按钮,打开波特 图界面,幅频特性如图 A4-16 所示,相频特性如图 A4-17 所示。从幅频特性可见中频增 益为 11.287dB(换算后即得到中频区的电压放大倍数),下限频率(增益为 8.287 左右对应 的频率值)为约 12Hz。
- 36. 图 A4-15 频率特性仿真电路 图 A4-16 幅频特性 图 A4-17 相频特性